Creating a Web App with Snowflake and Streamlit
Streamlit provides an easy way for users to turn their data into web applications. The app framework is open-source, and everything is written in Python. This means that you do not have to bother learning other front-end technologies such as HTML or Javascript. Your web app will also update as you save your source file, providing real-time results. Web apps on Streamlit are quick, user-friendly, and easily sharable.
Let’s Create a Web App!
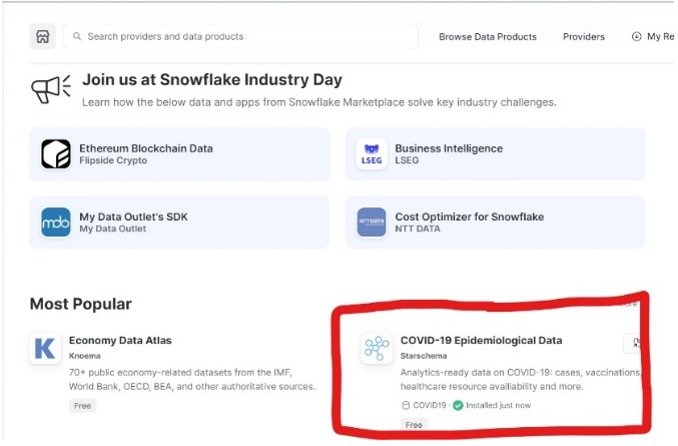
If you do not already have a dataset to use, I recommend navigating to Snowflake’s Data Marketplace and downloading a free database. The Data Marketplace is perfect for finding third-party data to integrate with internal datasets or in this case, experiment with. For this example, I used ‘COVID-19 Epidemiological Data’ from Starschema.
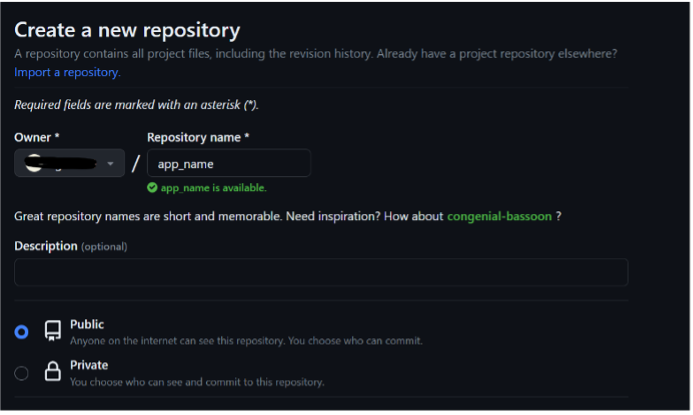
The next step is to create a new repository in GitHub. GitHub is a platform used mainly for software development and version control. A GitHub repository contains all the files and folders that you use for a project. The repository for this project will be used when creating the web app, so I recommend writing a name relevant to your dataset.
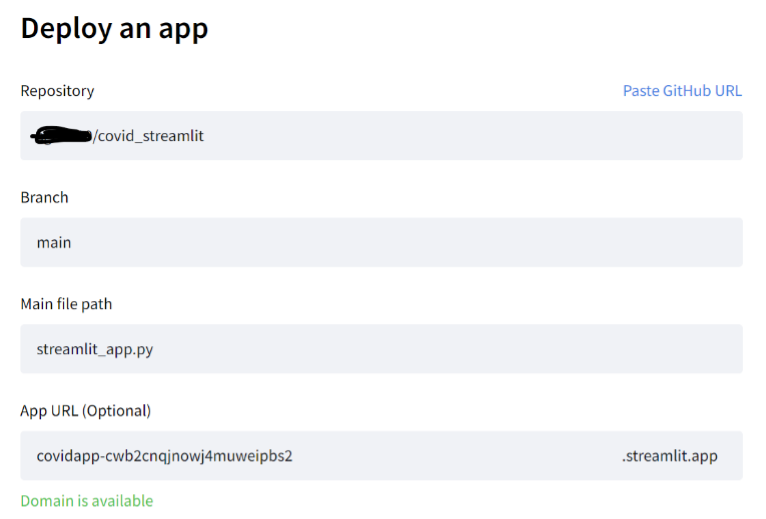
Once your new repository is created, add a new file called ‘streamlit_app.py’. This will be the main (and only) file for our web app and it will be written in Python. Next, navigate to Streamlit. If you do not already have an account, I recommend signing up. Notice how it asks to connect to your GitHub account? This will make the process even easier! After you’ve finished logging in, click ‘New app’ in the right corner. Streamlit will ask for the repository you just created along with the main file (streamlit_app.py).
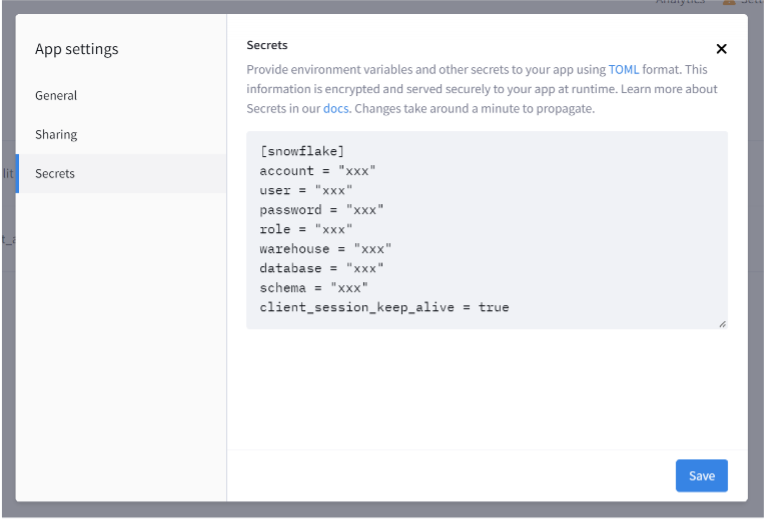
Once the web app is deployed, navigate back to the homepage, and access the settings for your new app. You will need to change the contents under the ‘Secrets’ tab. Streamlit needs your Snowflake account login information as well as your database context to connect both platforms.
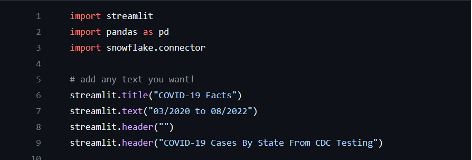
Now, let’s add some data! You will need to import Streamlit, Pandas, and the Snowflake Connector. Importing Snowflake Connector will connect Streamlit to any queries that you write with the database specified earlier. Pandas is a Python library that allows for easier data manipulation, especially with tables and data frames. Next, add a few lines of text. I added a title, text, header, and white space, however you can add whatever is relevant to your data.
Now that you have the necessary imports added, you can connect to Snowflake and start querying your data. I decided to analyze the number of positive and negative COVID-19 cases per state.
After the data is queried, you can display the results in numerous ways. I converted my data to a data frame with Pandas in order to change the column names and reset the initial index column. I then displayed my data as a table. After you save your file, the web app should be updated to show your results.
To make the web app more interesting, let’s add a chart! The process will be extremely similar to that of the first visual, but instead of a table, I used a bar chart. I also queried different data so that the chart displays positive and negative COVID-19 cases monthly.
If you followed along, your web app should look something like the following:
Conclusion
Using Snowflake to create a web app with Streamlit is a very simple process. It doesn’t take much scripting to end up with a great platform to display your data. Besides Snowflake, APIs can also be incorporated to make web apps more dynamic. Streamlit offers input widgets, media elements, layouts, and many other useful tools to customize web apps.
Links to Other Moser Webpages
http://znle.airllevant.com/data-analytics
References
Inspiration received from the following websites:
Official Documentation -> Get started - Streamlit Docs
Snowflake Training -> Snowflake Hands-On Essentials Workshops


